The utilization of 44/8: the reason I mapped IPv4 & IPv6
May 15, 2021
In the early days, when the Internet was just beginning, back in 1981, radio amateurs were allocated, by what is now known as IANA, an IPv4 block for usage and experimentation by all members of this hobby, internationally. This block was 44.0.0.0/8, which is a huge amount of address space by today’s standards, but effectively the only allocation size back then.
This network was mainly used under the “AMPRNet” name and utilized packet radio, or to put it simply, a packet-based network (like the Internet) over radio frequencies, wirelessly. This network was able to interconnect “hams” (the people that have been licensed to practice this hobby) around the world, and provide them with digital connectivity before (access to) the Internet was generally available.
Since then, very large communities were developed using these IPv4 addresses, with the largest by far being HAMNET that is mostly based in Europe for now.
But the Internet has also come a long way since then. Affordable Internet connections at workable speeds are available to large parts of the population and services tend to be able to function okay on a public network, reducing the need for private communications over a non-Internet medium.
So how is “44/8” being used today?
The Sale
The first major change that we see since then is the sale of a quarter of the addresses to Amazon Web Services for use in their Cloud. This happened in mid-2019 for $108M. This sale reduced the IP space to “44/9 and 44.128/10”, but I will keep referring to the ham part as 44/8, still, as it’s more convenient.
Sub-allocations
The network is currently split into two parts. The first one, 44/9, with almost 8 million addresses is allocated to the United States of America. With a few exceptions, each state has a /16, which is about 65,000 addresses, and has another /16 network available right after that for future growth. The major exception to the above is California that currently has at least 7 /16 networks, totalling almost half a million IPv4 addresses.
The 44.128/10 part, with 4 million addresses is currently allocated to the rest of the world, i.e. almost all countries except the U.S.A.. The general rule is that every single country receives a /16 network and then further allocations could be made for regions of this particular country if needed. Here the exception is Germany, because of the success of HAMNET, that has 5 /16’s to cover the entire need for space. The interesting thing is that two of them are still in the part of addresses that has been acquired by Amazon, and is still undergoing a very large renumbering effort for the past 2 years.
You can view the current allocations in the ARDC Portal. Of course, it may have changed by the time you are reading this article.
Here is a graphical representation of these country-level allocations, with the exception of the U.S. that is shown on a state-level. Click the image to view that in full resolution where each pixel is an IPv4 address, but be warned that it is 4096 x 4096.
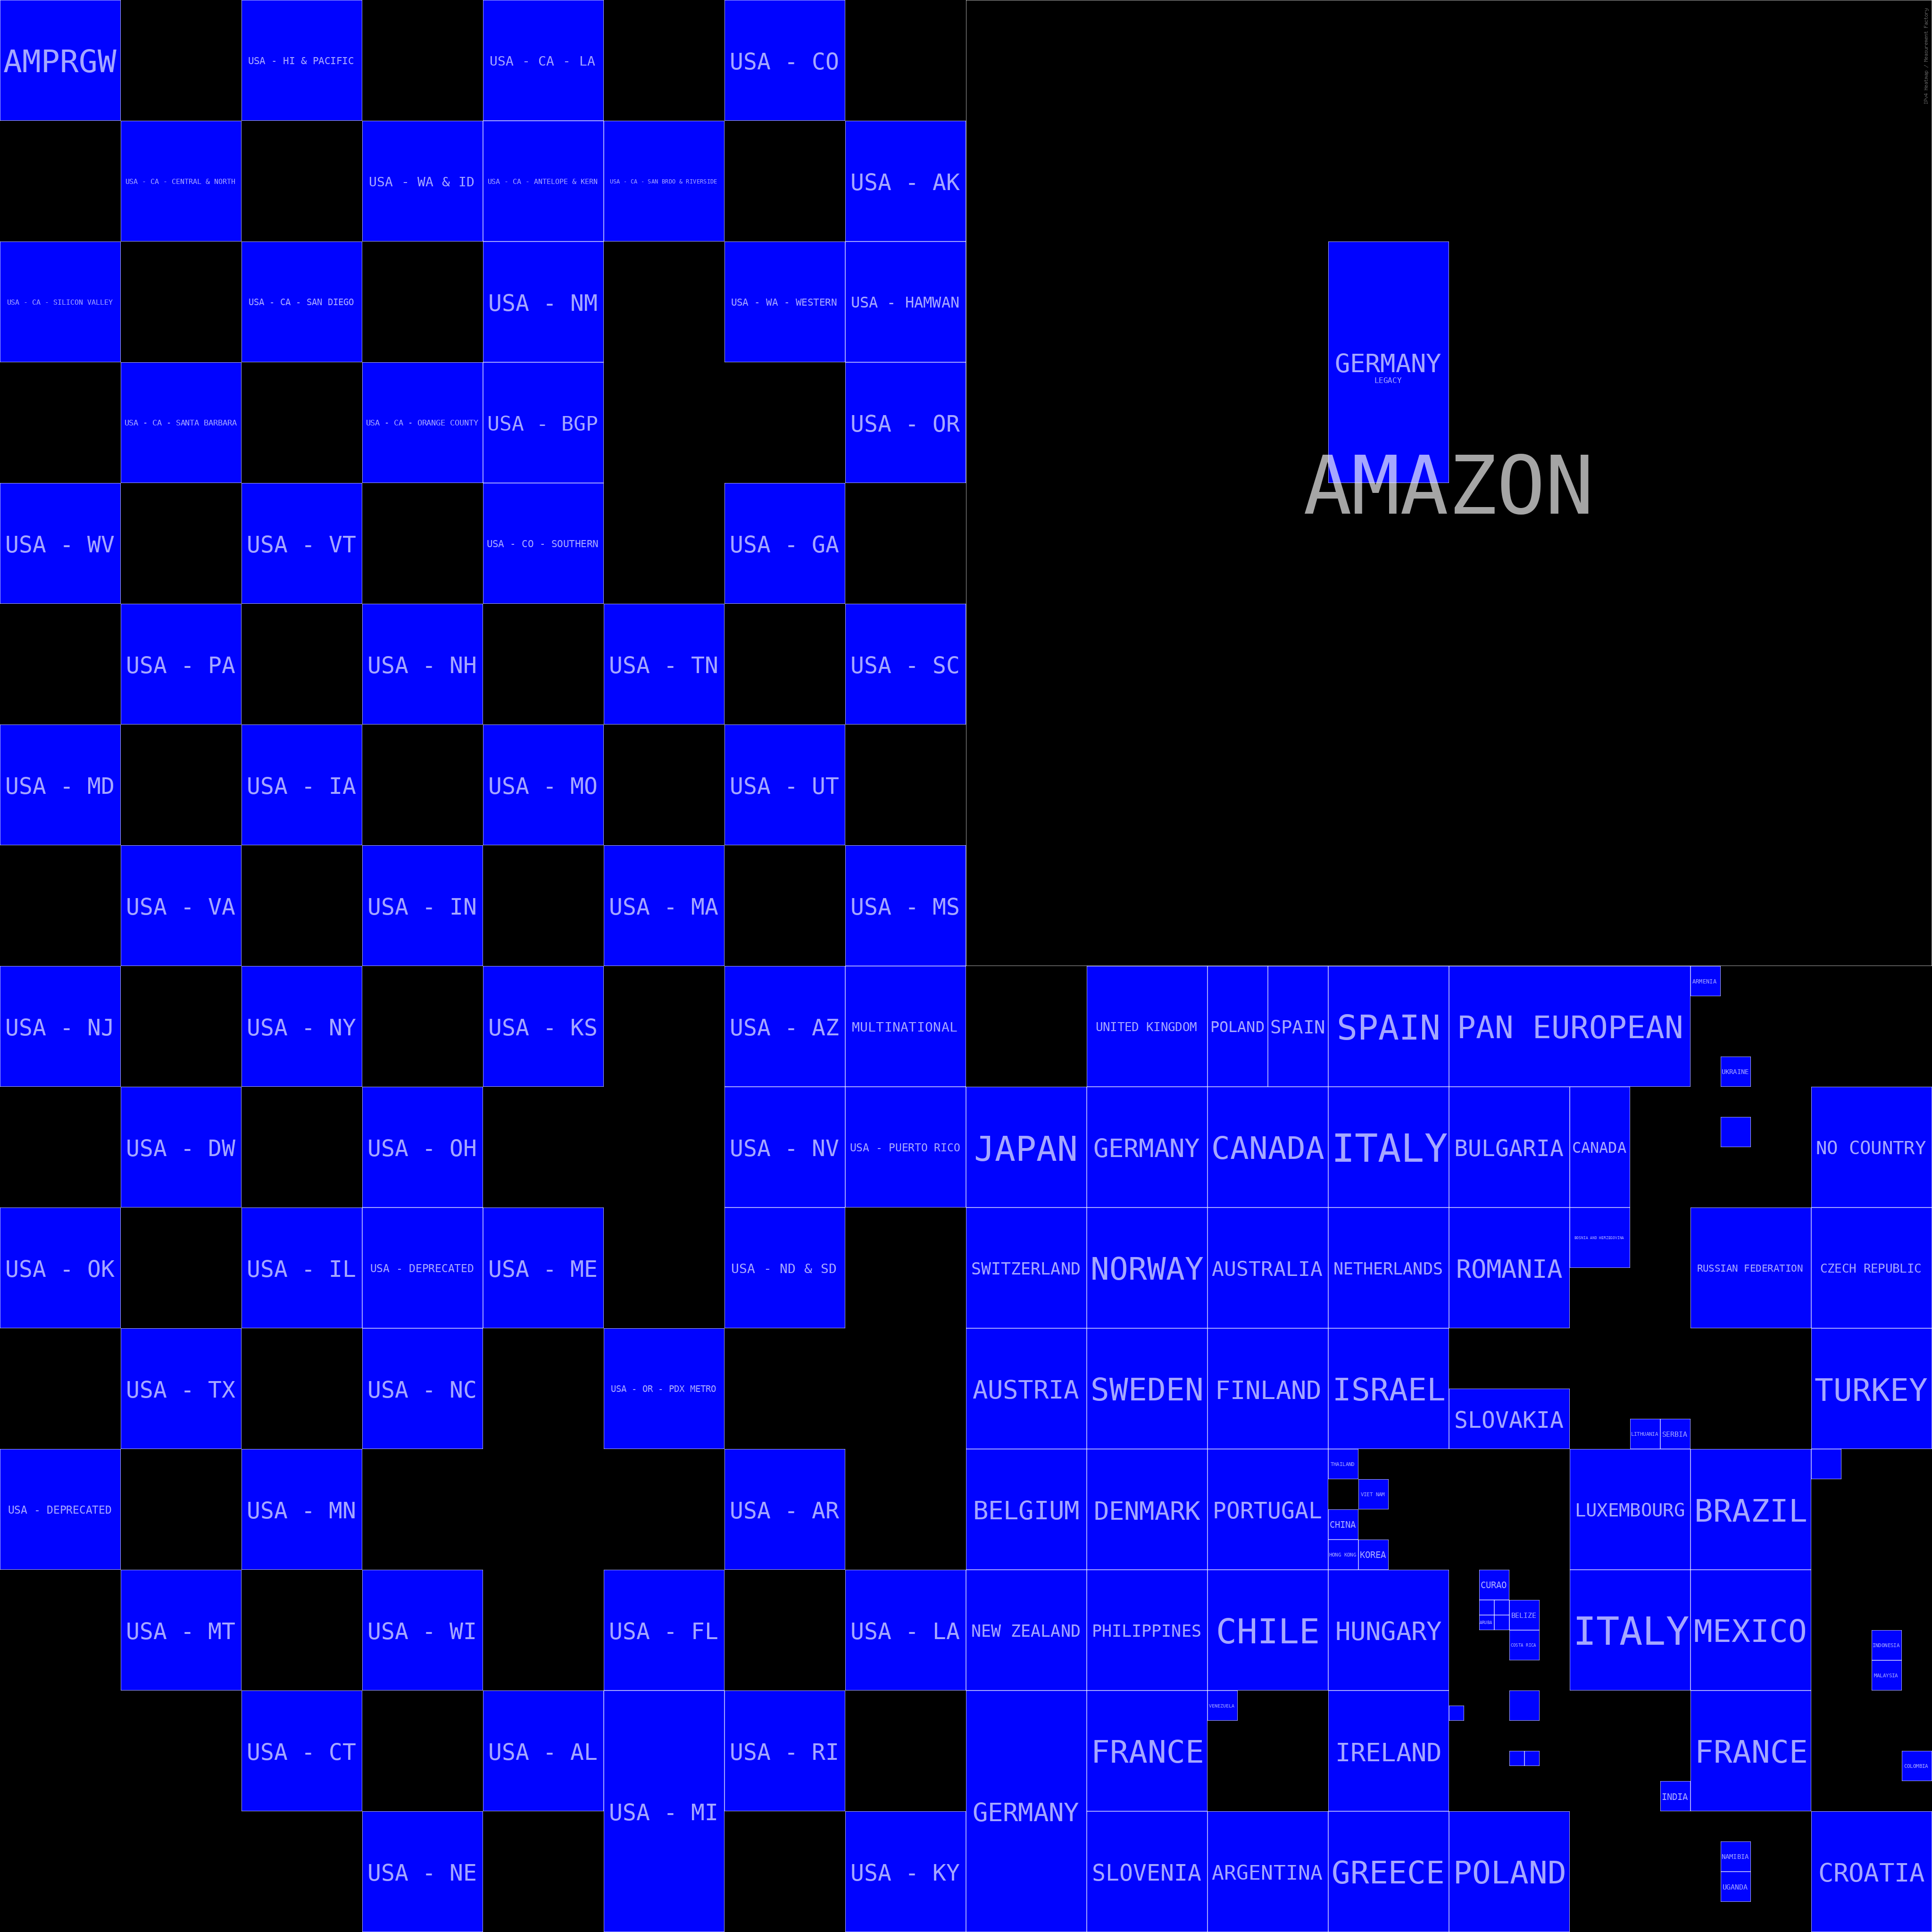
This map is created using Hilbert Curves and each square is a /16 network. You can clearly see the yet-to-be-renumbered Germany block within what is currently Amazon IP space.
But what about usage?
Having this map of all the country-level allocations is great, but it does not help us understand exactly how much utilization there is. Sure, we can see that almost 11.5M addresses are currently allocated for some very broad scope (country), but it doesn’t mean it’s all used.
Indeed, if you explore some countries on a lower level, you can see that a tiny amount of their /16 is allocated to end users. We’re taking Greece for example here, with 44.154/16, and mapping only their allocations to end users:

Even here you can see plenty of usage, i.e. a large part of the space is allocated, but this just means that there exists a database entry that marks that space as currently being used by some person.
In order to see the actual usage, we need to see how many devices live there. This is not of course the best metric, but it can give us an idea of what’s happening. And the best method to see if a device is there is to check if it responds to pings (ICMP Echo). Of course, this is even less perfect, as someone may block it on the firewall, but it can give us some idea, and it’s the best thing that can be done without having to ask every user in a survey.
So let’s ping 44/8
Running a ping check on so many addresses is not an easy task. Especially for a network like this. You need to send a very large number of packets per second so you can finish within a lifetime, but you need it to be slow enough to not have any packet loss (and therefore have hosts appear as “down” when they’re not). Also, in this particular network, a number of addresses is usually behind (very) slow links that can be measured in the Kb/s, so you don’t want to max out their connection speed. You also have another special part..
The multiple 44/8’s
If you have a network that began around the same time as the Internet, and it is comprised of people like the ones of 44/8, you get to realize that it’s not treated like the Internet.
First of all, if you know that all the other people of the same hobby connect to you from a 44/8 address, you may have a firewall set to only allow connections from this network. That said, scanning from a “normal” / “Internet” address, outside of this network, may be blocked on a number of firewalls. So depending on your source address you may get different results.
You then run into another problem. Not all 44/8 is destined to be on the Internet. A large number of that network is private, and is only used internally, over wireless equipment on the amateur radio frequencies. You can’t access it by design from a normal connection. So you will probably need some way of being able to access these hosts as well.
Then you have a technology that is used by hams which is called an IPIP
Mesh. This is something that I’ve only seen
being used in 44/8 and essentially it has a list of all mesh peers (end users),
their public non-44 address, and all the networks that belong to them. Then,
all participants download this list frequently, and set up n IPIP tunnels,
one for each other ham, and add a static route to their prefixes, which they
get from that list. It’s like hard-coding the entire routing table every few
minutes. There are some optimizations and tools to make this easier and not as
bad as it sounds but it’s more or less that, and allows for true mesh
connectivity between all peers. Having access to this mesh is important, and
also requires the run of regular pings to account for public IP changes of
participants where IPIP traffic may be dropped.
Scanning from the Internet
For the first run, I tried to ping the entire 44/8 using a normal IP Address in
the 193.5.16.0/22 range. This would help us see what is visible for everyone,
on the Internet. I did not scan Amazon’s IP space as it would be out of
scope for this post. That being said, I also did not scan the German part that
is now AWS, as from any Internet-based network it would go to AWS.
The resulting image can be seen here. Of course, click on it to see that in full screen if you’d like.
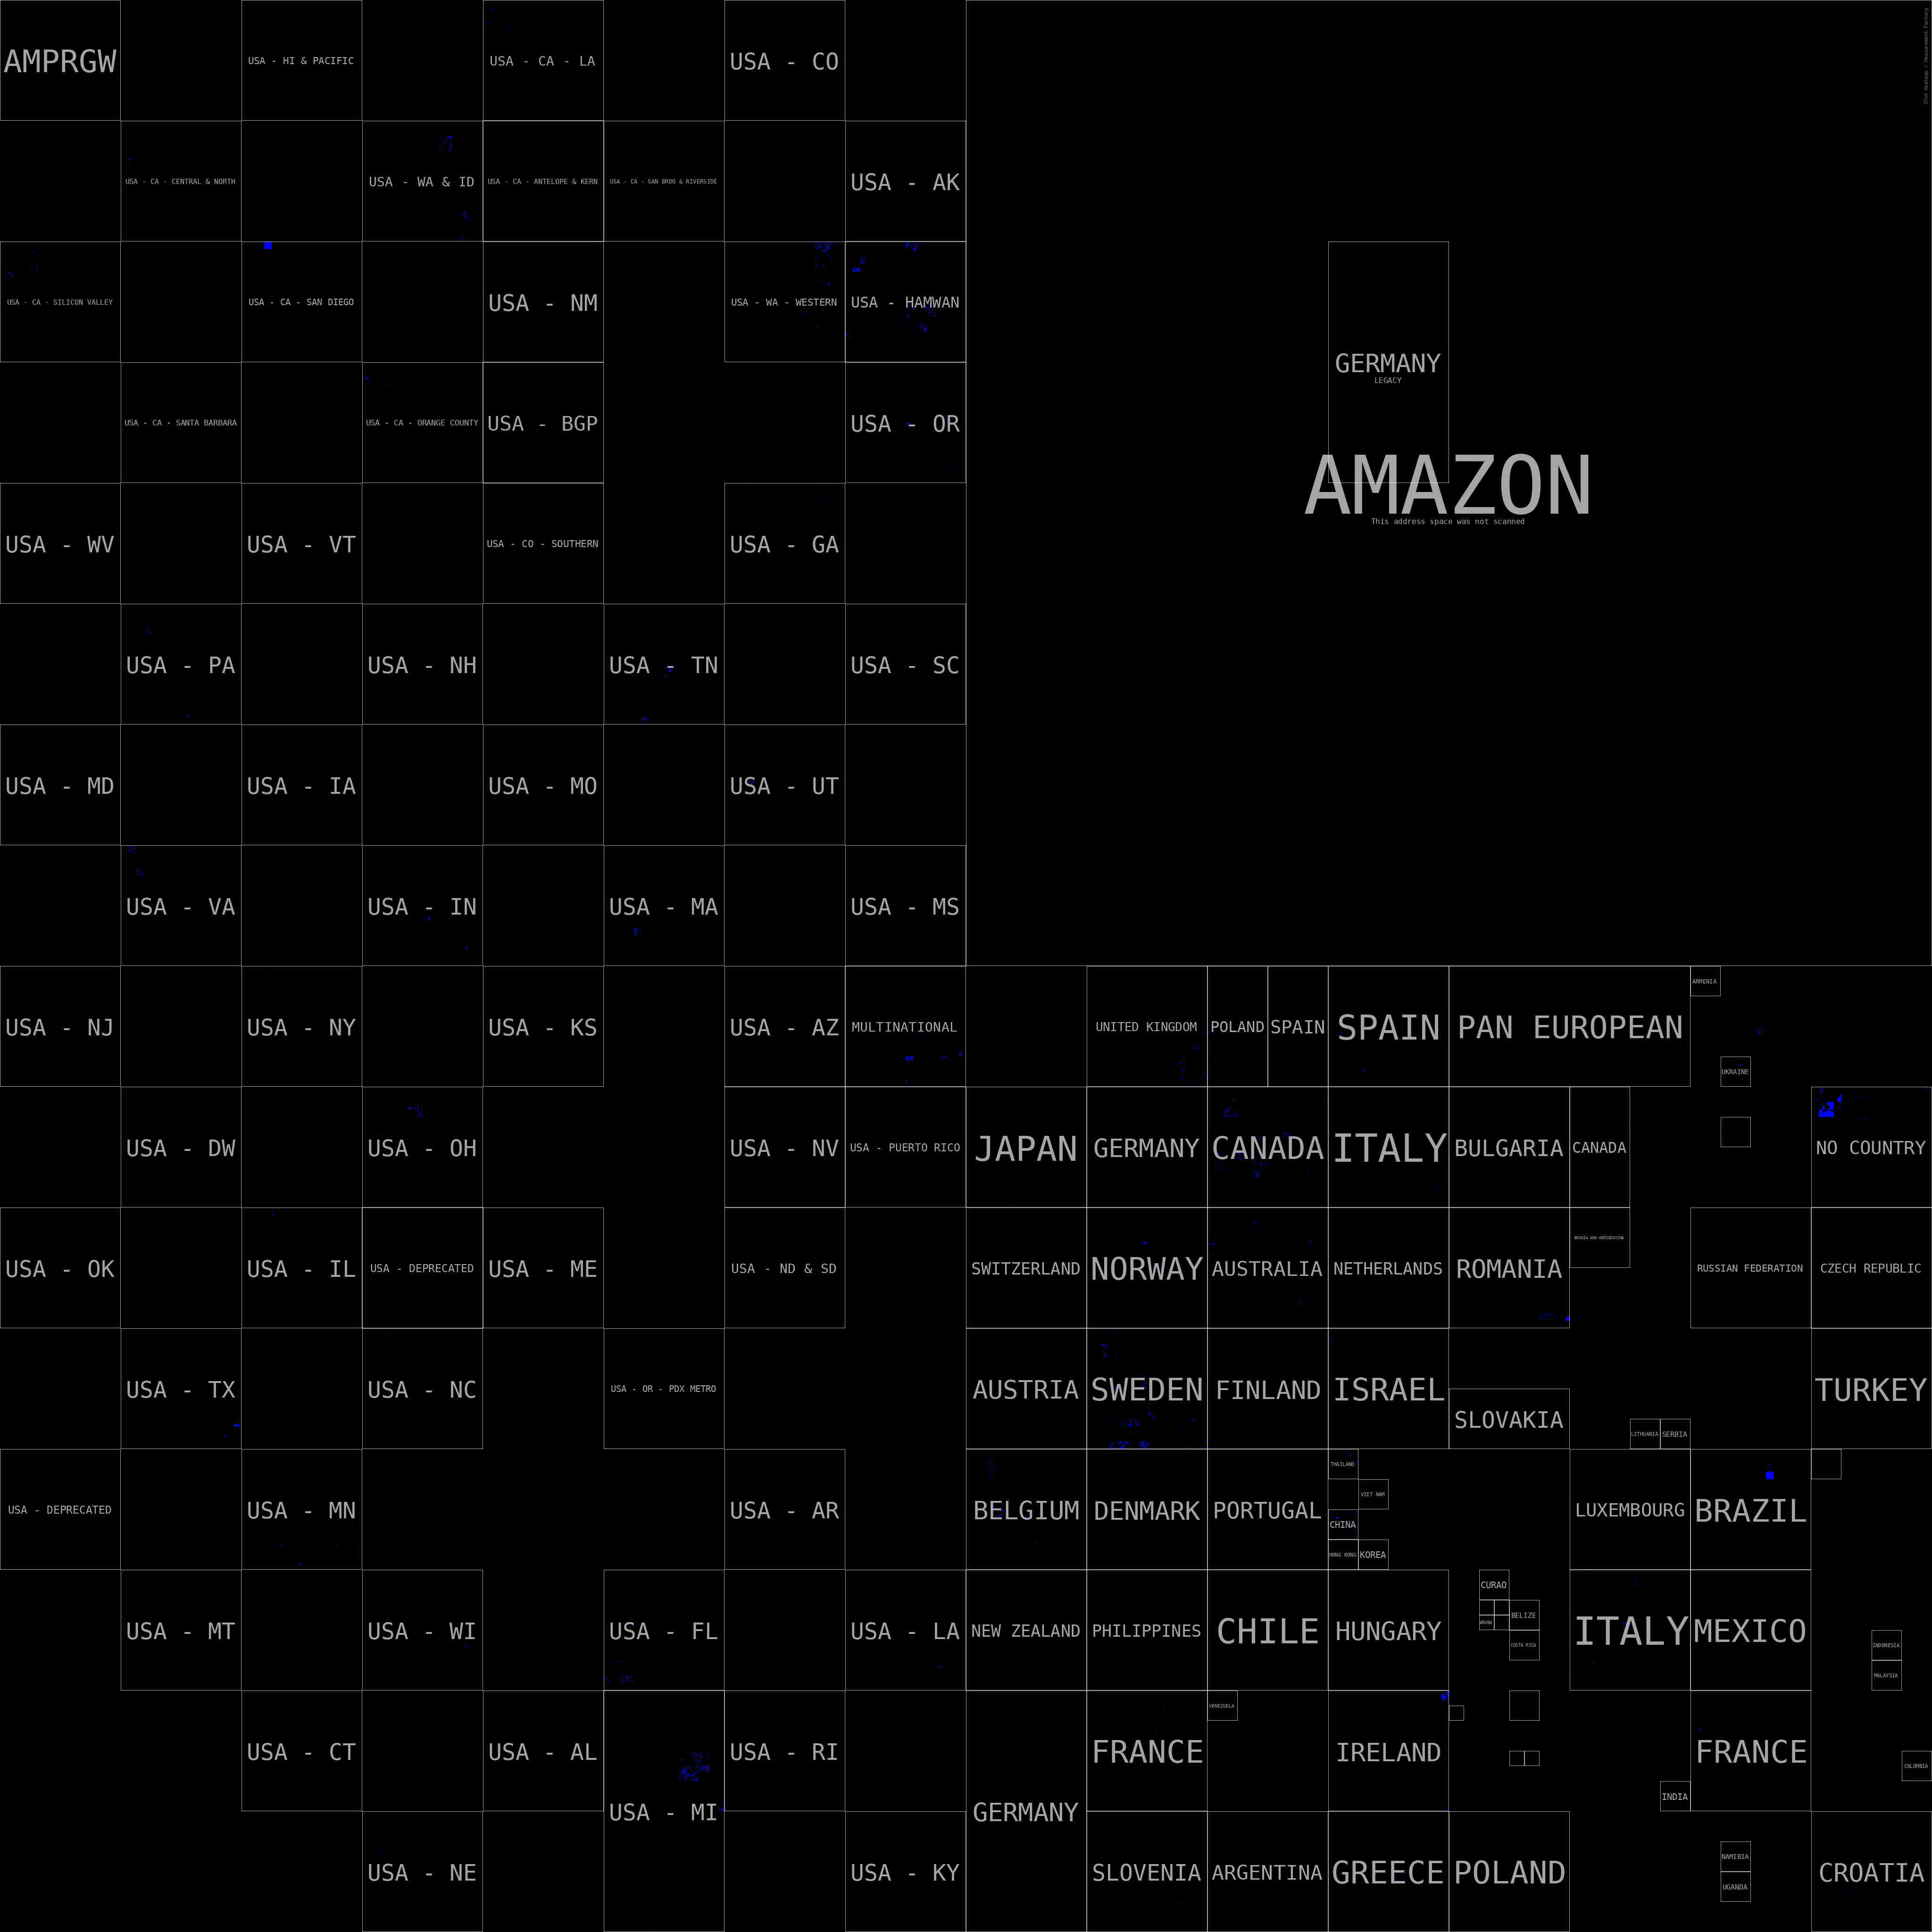
As you can see, the actual usage over the entire /8 is minimal from the viewpoint of an Internet-connected host. The total number of addresses that responded to the ping check is in the low thousands. They’re mostly focused on a handful of /16’s. I reran the scan slower and also at multiple times in the future and the changes were not significant – in the low tens.
Well-connected
The second experiment involved scanning from a host that had the best connectivity possible: it was connected to the Internet, to HAMNET, to IPIP Mesh, and in general was present in all of the possible locations. This would produce the best results as it can “see” the most amount of 44/8 possible. I need to thank Jann (DG8NGN) for providing me with this host and saving me the trouble of having to set up IPIP Mesh ;) By carefully modifying the routing table of the host, we were able to achieve a scan of the Germany-in-AWS space without sending any traffic to Amazon.
You can see the hosts that are alive here on the following image, which you can click to view in full resolution. If you do, there may be an Easter Egg there for you.
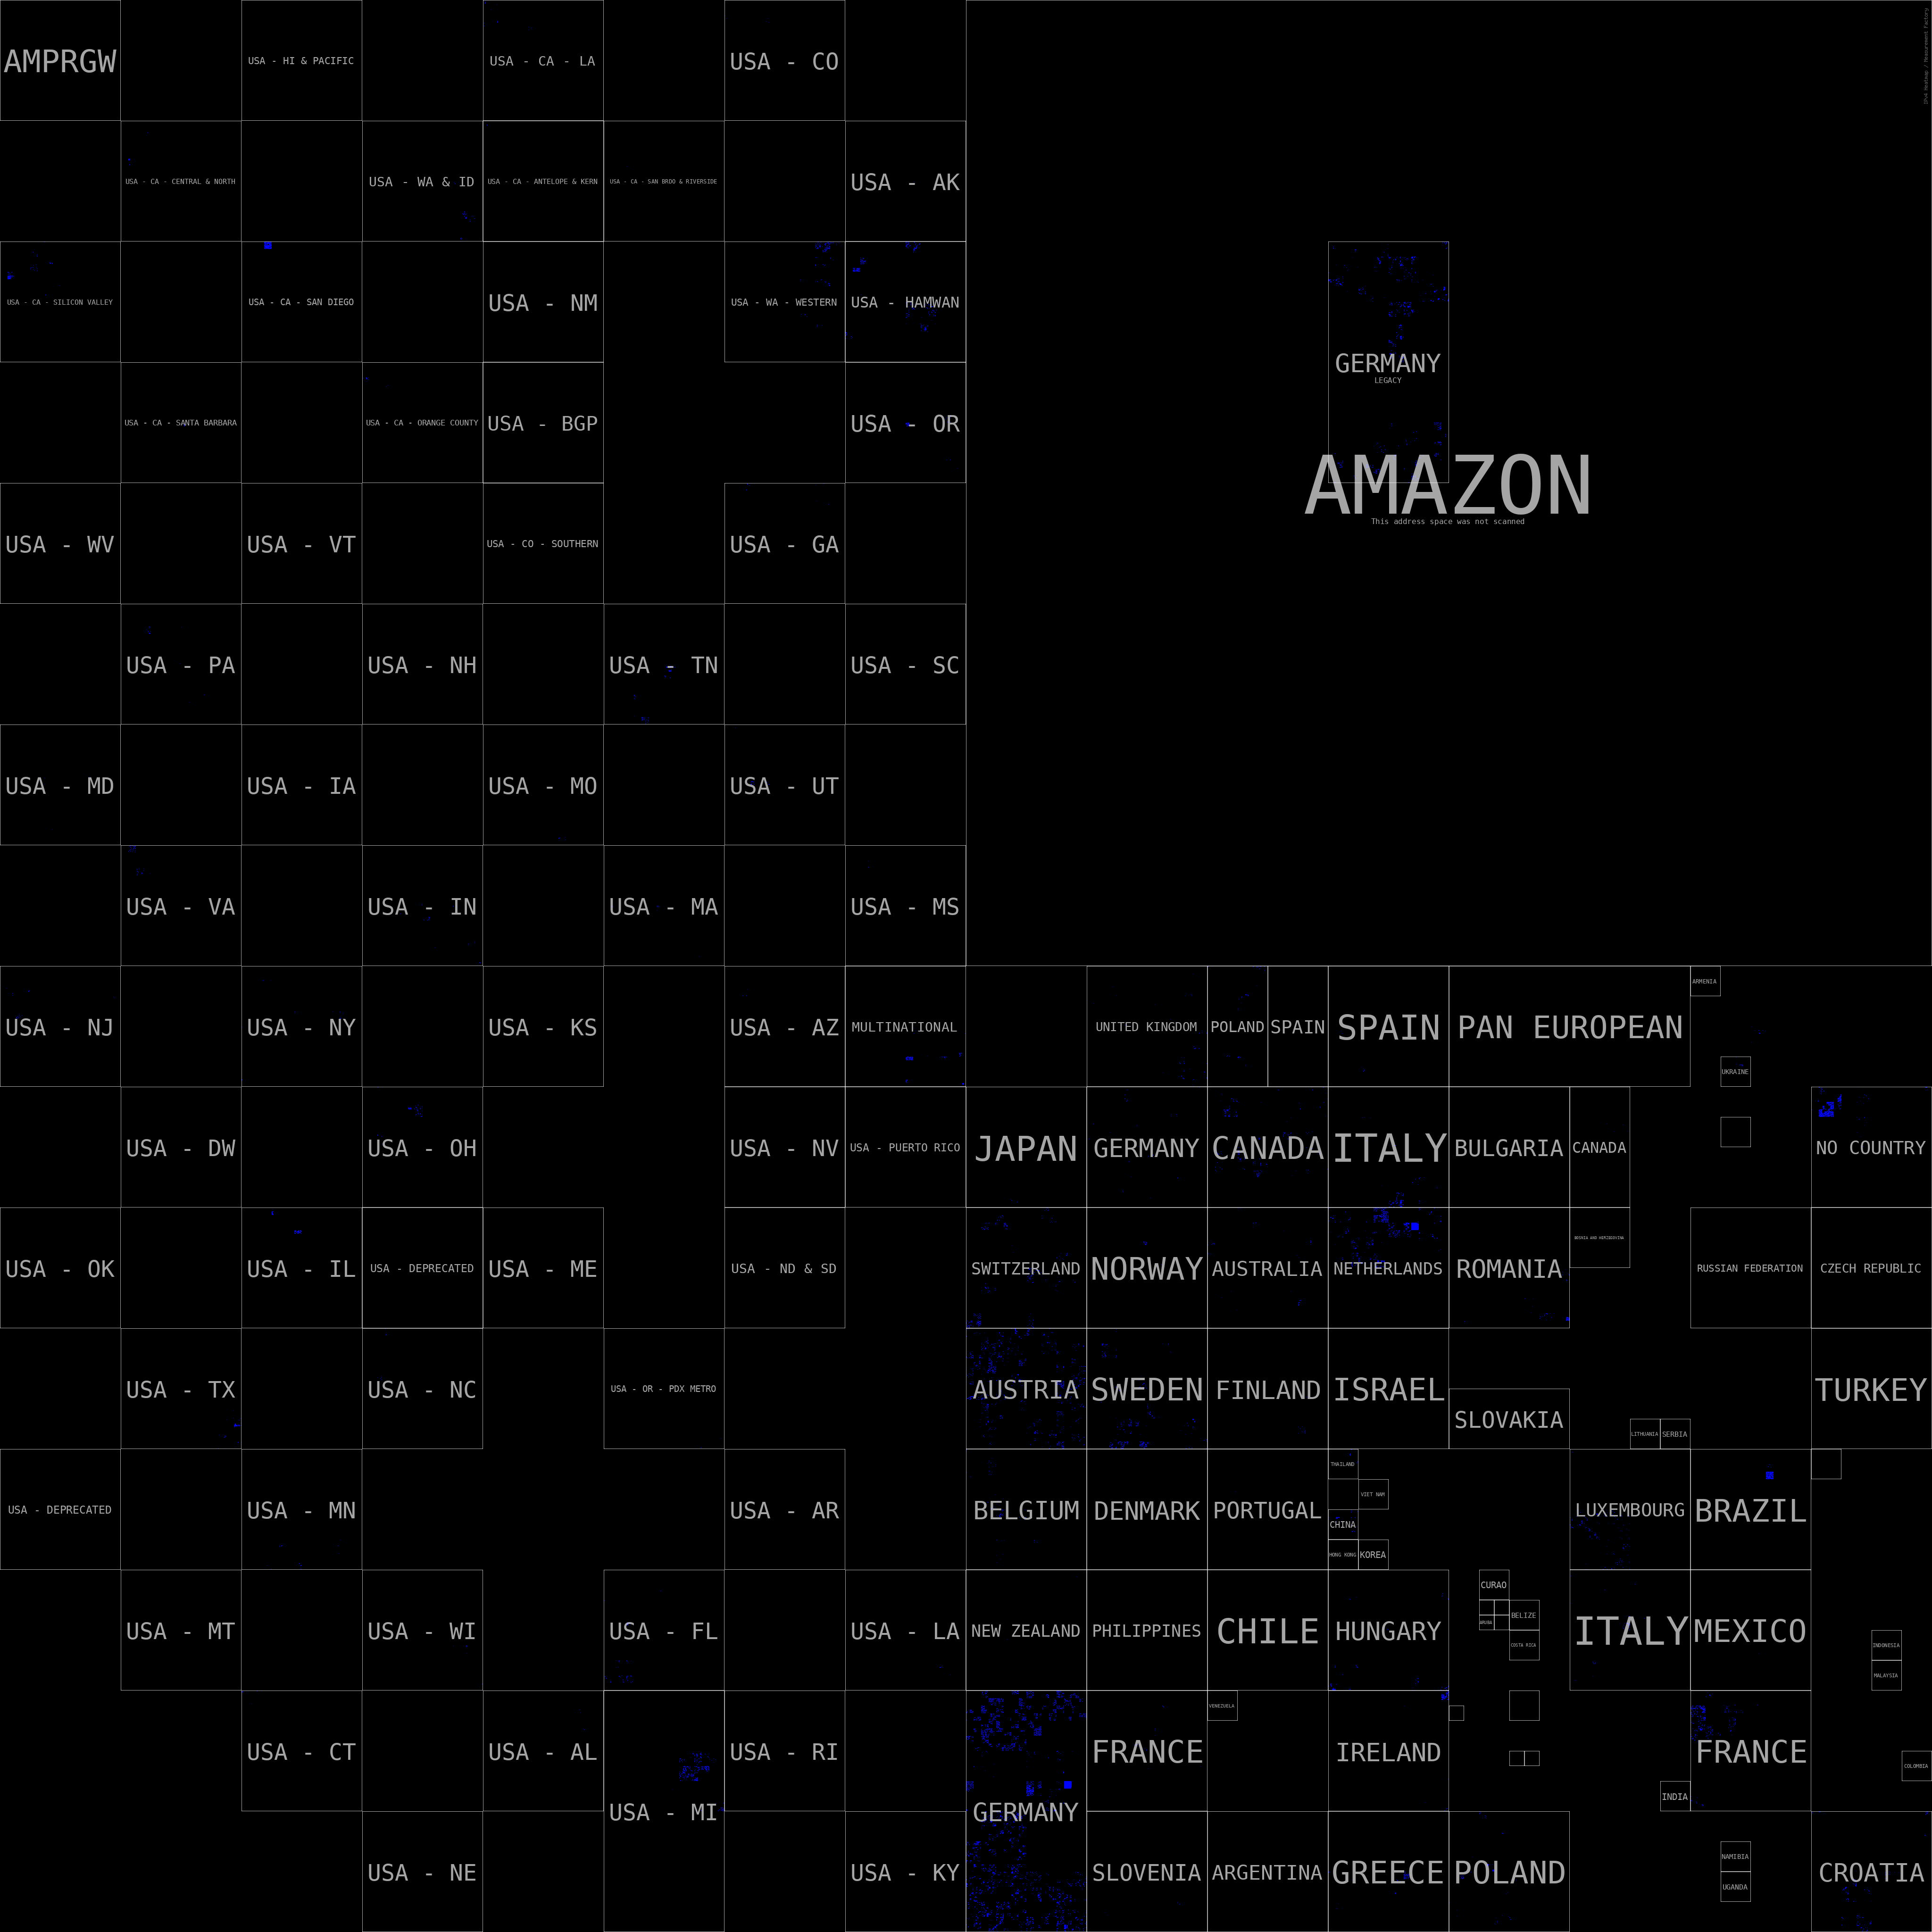
It’s not like everything suddenly lit up but if you look at countries like Germany or The Netherlands, you can finally see hosts! Those countries are just some of the ones that only appear on the non-Internet version of 44/8. In fact, more than 75% of the addresses do not appear on the public Internet, but are only accessible (at least to pings) from other hams only.
A curious case was The Netherlands. They had a firewall set up for their entire
/16 that blocked you for some amount of time if you sent traffic to a (large)
number of addresses. So if I sent any packets to e.g. .x.y, then my address
was blocked from accessing the entire /16. That made them completely dark in
the previous map despite the fact that some of their addresses are fully
accessible from the Internet. Thankfully, if you sent packets from a 44/8
source, this firewall rule did not apply, and a scan of the country was
possible.
For those wondering, there are some squares that are almost perfectly filled out. These are /24 networks that run the EchoLink Proxy software. EchoLink is a technology that allows hams to access and transmit to remote radios over the Internet. Due to the way this software was written, it requires an entire /24 for a single instance and is extremely wasteful. You can see one in Germany and one in The Netherlands for example.
The Easter Egg
If you want to look for it and haven’t found it yet, go back. This section contains spoilers.
It turns out that if you know people are going to scan your network and then create nice maps of it, you can do things in advance. It’s like if you know that the Google Street View car is going to take pictures soon. You can prepare for the moment.
So if you zoom into “Greece” in the full scan above…

As you can see, Greece is heavily underutilized, despite having a large part of it be allocated to end users. But by only using a /24 (or almost $8,000 today) and more hours than you should, you can write your own callsign on the IPv4 map! Here you can see my own callsign, SV2OIY, written on the image, by carefully calculating the exact IPv4 addresses that need to be online and then making sure that they respond to pings. You can create your own art like this, but in order to be visible on the full Internet map you will need a /16, or a little bit over $2M in today’s prices. If you ask me, it’s totally worth it. It’s the most expensive game of Pixelflut I know to date.
Other /8’s
Okay, 44/8 may seem a little bit empty. But is it? Let’s try to compare that with a “typical” /8 that was assigned to an LIR to hand out to end users. I picked a network that I thought would be the extreme opposite. This network is 185.0.0.0/8. This is RIPE’s “last /8” which means that it’s the last block they received from IANA before they ran out of IPv4 many many years ago. All allocations here are typically a /22 and if you believe the rumors, a lot of people became RIPE members just to receive the address space and then sell it off for a profit, usually splitting it into further smaller blocks. So it should be highly utilized and very fragmented. Let’s see.

The difference is clear here. The utilization is far higher and you can even see entire /24 blocks that are filled to the brim. And many of them. Probably not with EchoLink Proxies. Of note are the first two /16’s that are almost empty. Can you guess why?
Other /0’s
You may say that picking this network is not a good comparison, and that maybe if I picked something else it would be more fair / better. I hear you. It is for this reason that I decided to ping 0/0, or, alternatively “all of IPv4”. Yes, that’s right. I pinged every single host on the Internet, just so you, the reader, can decide which network you want to compare 44/8 against.
Before going over the final image, some words. I ran this from 193.5.16.0/22,
which means that you will not see the full 44/8 in this picture, only less than
25% of it. Just the “Internet” part. Also, the address space is large (but not
too large ;)) and plotting it would require a 65536 x 65536 image. As computers
are not good at displaying an image that large, especially with a file size of
hundreds of megabytes, or gigabytes, the image you will see is 4096 x 4096.
It’s still close to 10 MB, so be careful when clicking on it. That being said,
each pixel is not an IP address but it’s a /24. That means 256 addresses. So
how can you tell how many addresses are online? This is done based on the
color. It immediately makes it difficult for color-blind people, but
unfortunately I couldn’t come up with a better way of representing this. No
hosts would be the color black, one host would be dark blue, and bright red
would be 256 hosts. Everything between these values is a gradient.
The scan was done at a rate that is not considered excessive and could cause problems, namely a /16 per second. It started from 1/8 and went up to 223/8 sequentially, and scanned IPs at a random order (to not create hotspots where a single ISP was getting all the traffic) at 65536 packets per second. That said, if you own a /8 and you advertise all of it on the Internet, you got the full rate just for you, and if this caused problems, I apologize, but I suspect it was a tiny fraction of the background noise you must be receiving already. This more or less guaranteed an average of one packet per second per /16.
Here’s the traffic graph of the particular host that was scanning the Internet:
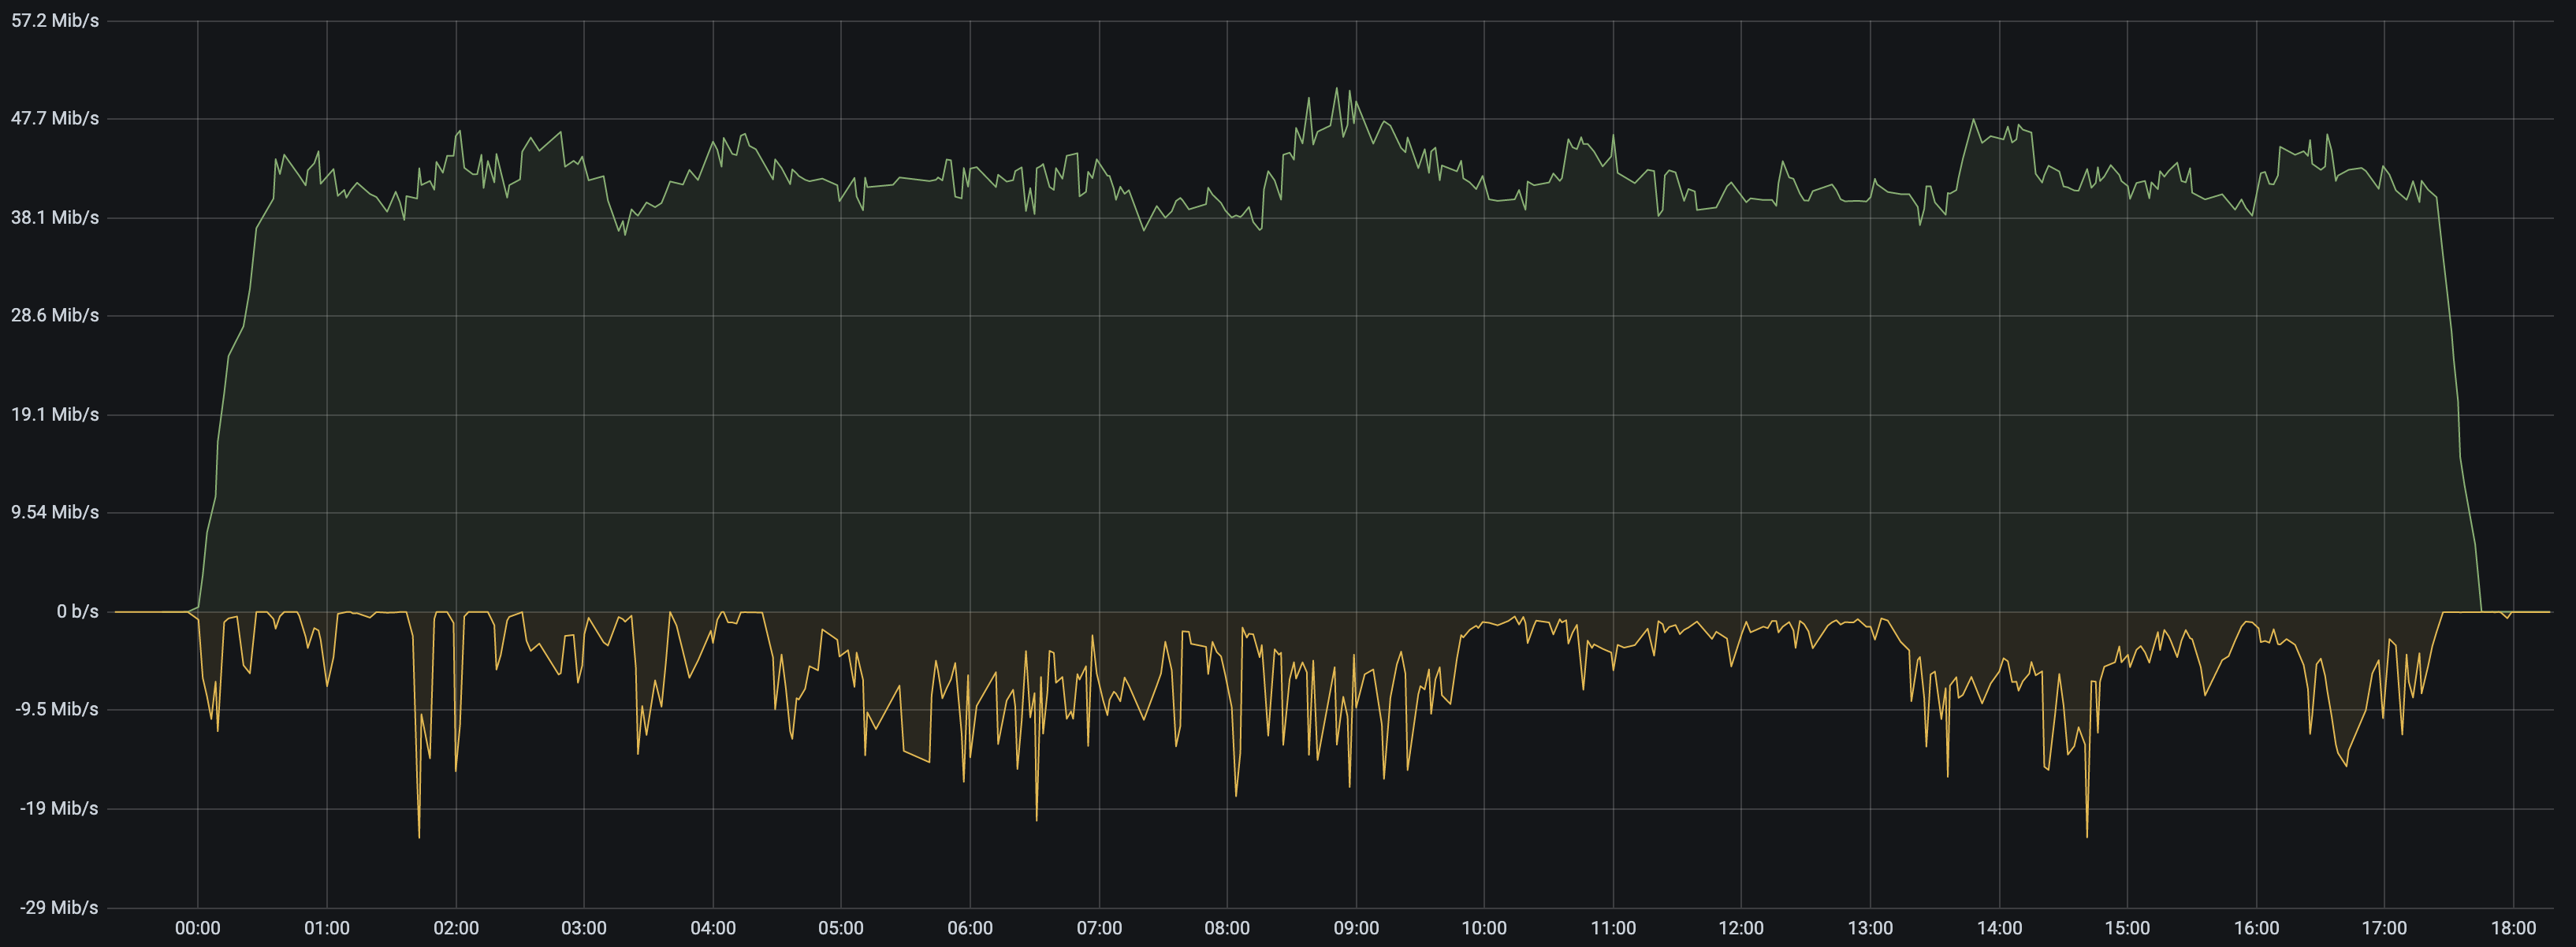
The first thing you can see is that the scan took almost 18 hours at this rate. The positive axis (green) is transmit (sent packets) and the negative axis (yellow) is receive (responses from hosts that are alive). Of course, the transmit is more or less the same throughout the hours, and the receive is varying depending on how many hosts respond. At midnight it was 1/8 and by afternoon it was 223/8. There are clearly some hotspots in responses for some particular /8’s. This should give you an idea of what’s coming.
Before showing you the map, I would like to point out that this scan happened after the US DoD announced 175M IPv4 addresses on the Internet so I am now part of their “security research”. I hope that this is fine.
Here’s the map! Click on it for the full resolution, but be warned that it’s over 12 MBs.

This is all of IPv4. There’s nothing more. In the image above you can see the
368,396,860 (out of 4 billion) addresses that responded to pings on May 7th,
2021, from 193.5.16.0/22.
The labels that are used are not really accurate as a huge number of transfers
happen between RIRs (basically continents) so blocks that are marked “ARIN” may
include non-North-American addresses. They are based on who was assigned the /8
from IANA. The “Various Registries” parts are mostly IP space that has the
LEGACY status, i.e. it was assigned before the RIR system, and was not an
entire /8. The 185/8 block is in the top-right quarter of the bottom-right
quarter and it’s the one that looks like random noise.
As you can see, there are many more /8’s that are seeing significantly less use than 44/8. Some of them are even completely empty. Each of these blocks is estimated to be worth between half and a billion US dollars and the U.S. Department of Defense currently has 13 of them, all of which have 0 hosts responding to ping within them.
If you want to see how the Internet looked like in 2018, you can see that in this blog post by Ben Cox. Looking at the two images, you can clearly see some neighborhoods that got a lot of people moving in, including 185/8. I guess it will only get worse from now on, unless we finally move to IPv6.
And since I mention IPv6, here’s the map of the IPv6 *allocations* to *RIRs*. You can see the total IPv6 address space and the white boxes denote the allocations by IANA to the RIRs that will then have to subsequently give to end users (ISPs). Most of the space given out to RIRs hasn’t been allocated to these ISPs yet, so if we could somehow magically ping all of IPv6, these squares would be mostly black.
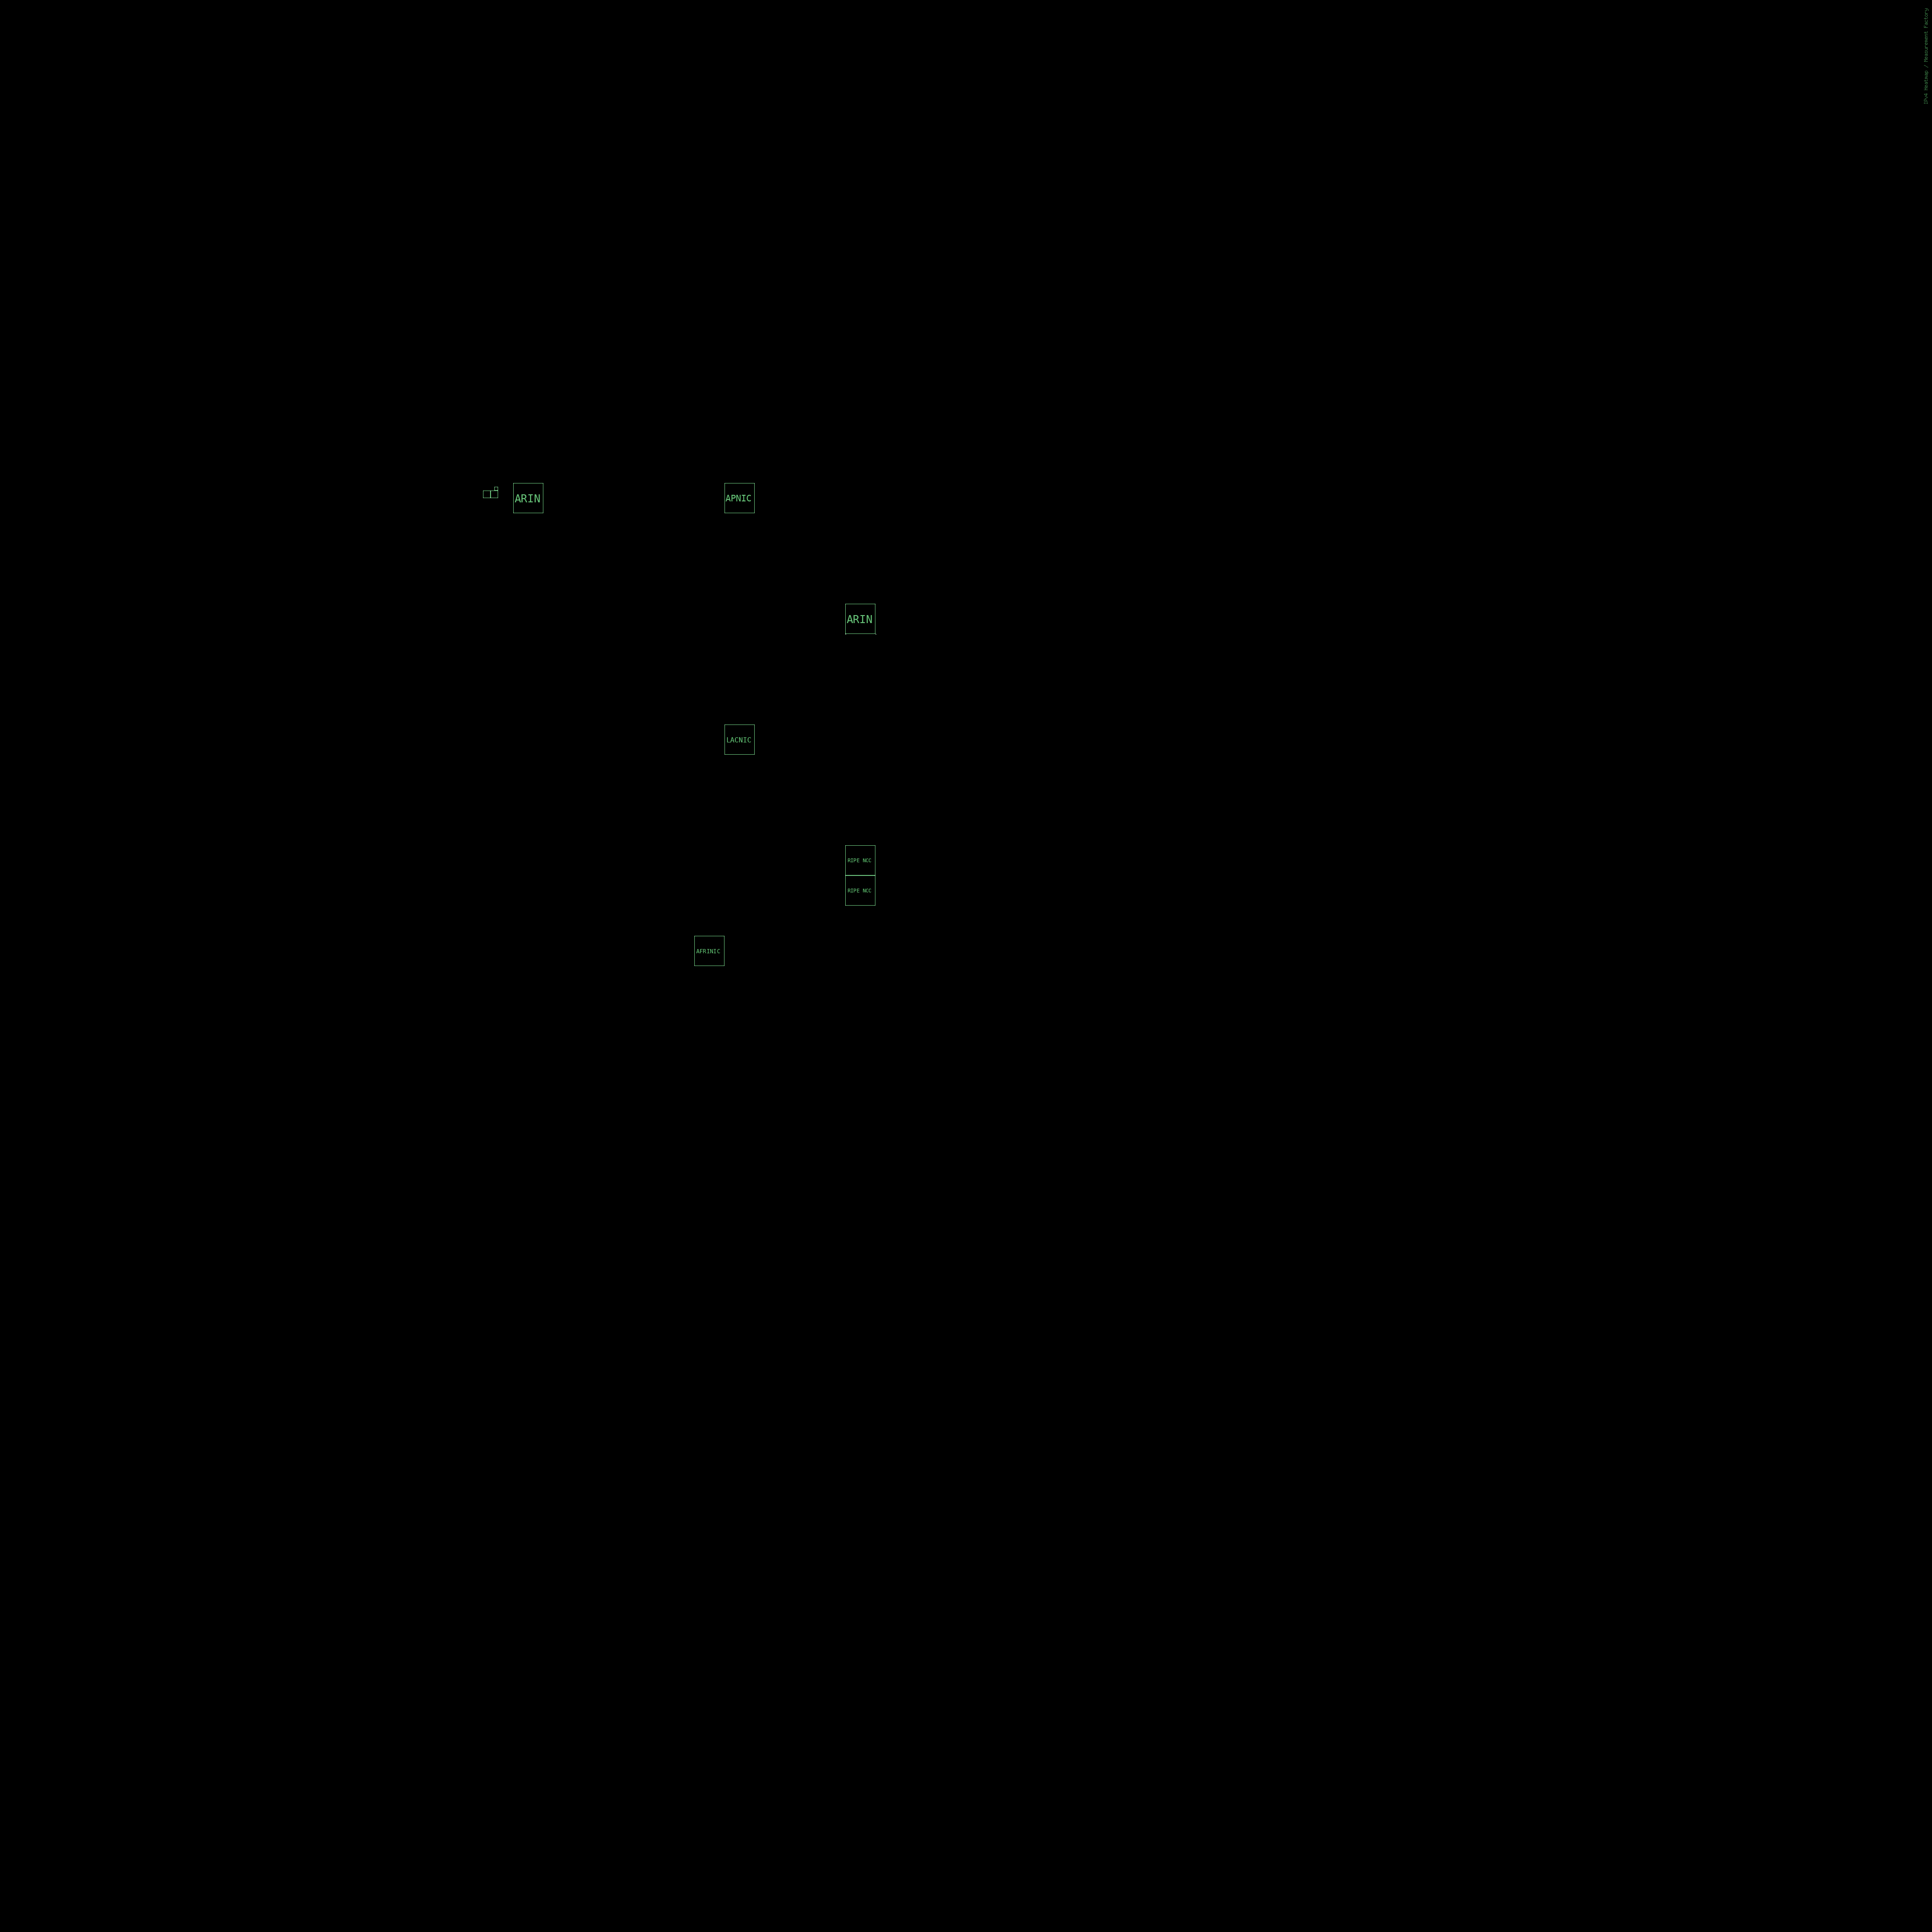
No, this is not a blank image. You just have to look really hard, and that’s all of IPv6 we’re currently allocating for use.
Epilogue
The reason I analyzed the 44/8 space was due to my role as a member of the ARDC TAC, and my duties of managing the IPv4 Address Space, planning for the future, and improving the processes under which it is being operated and allocated, as well as IPv6 @ Amateur Radio. This is work that has been going on for the past few months and involved a lot more analysis and much more detail in order to convert this all to actionable intelligence that can help in decision-making about the IP space. This is just a small part of all the work that I felt would be interesting for people to see in a broader audience. It also helps to shed some light into this “Network 44” that became more famous by recent events ;) . I will try to be more open and blog about my work in ARDC more often in the future, so let me know if you like this, and even if you’d like to attend talks for this type of content in events & conferences. I feel like it would benefit everyone to have more outreach and engage with more people about this network and all the stuff that’s being done. This post only includes my work, but a lot of others have, and continue to contribute to ARDC and the future of it, so I’d like to thank them all for what they have done so far. I hope that you will see more content from us in talks or an ARDC-specific technical blog or some other medium in the (near) future.